


This is a spectro-microscopy technique, coupling spectroscopy measuring the the absorption of infrared radiation at different wavelengths in a microscope.
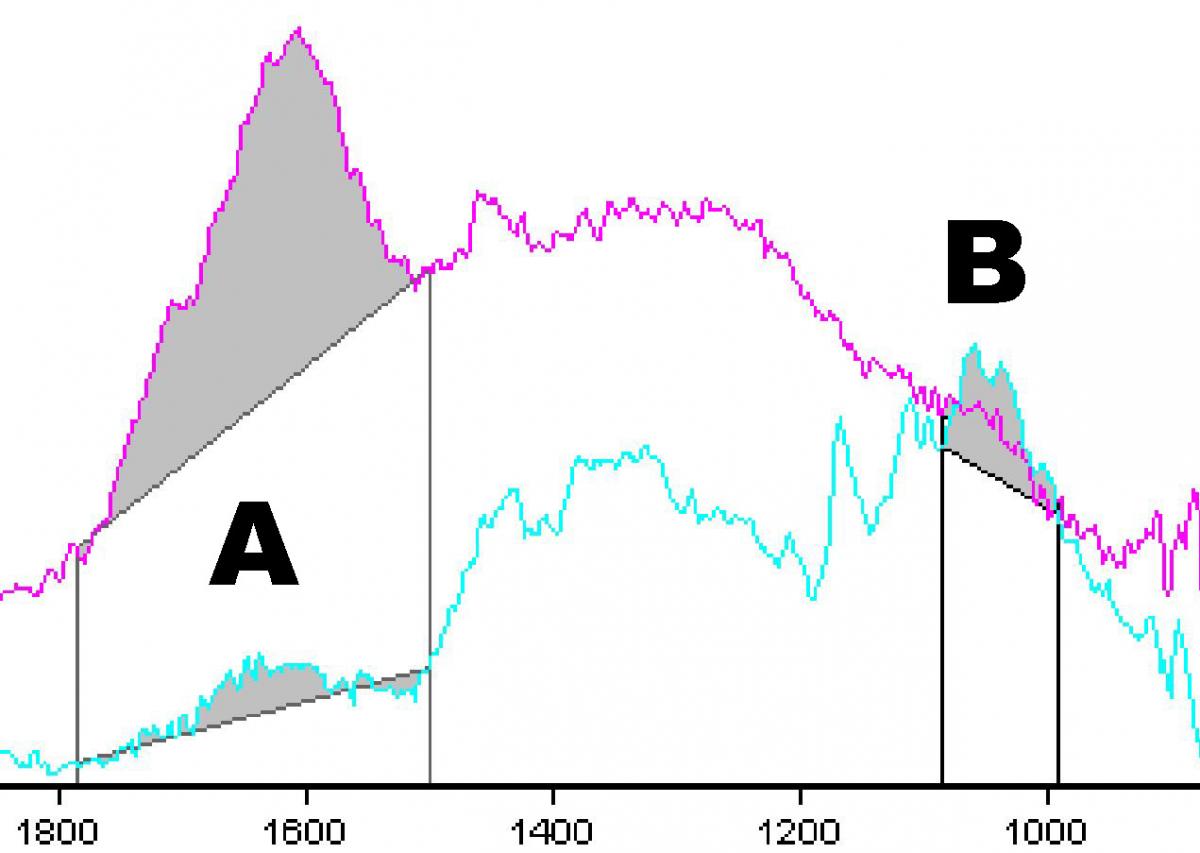
This can be used to identify organic molecules and minerals. The graph below (on the left) shows two infrared spectra of two different organic compounds.
The height of the band A is proportional to the quantity of aromatic C=C bonds and the band B to the quantity of C--O bonds. The spectrum profile (peak/band heights) is very different between the two spectrum, hence indicating very different molecular signatures.
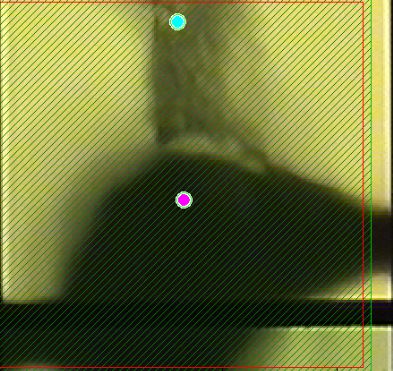
The image on the right (of a zone 60 micrometers wide) shows the spots where the two spectra on the left were recorded. The dark zone at the bottom (pink circle) is a chitinozoan fossil, and the lighter band at the top (blue circle) is a paper fiber contaminant.
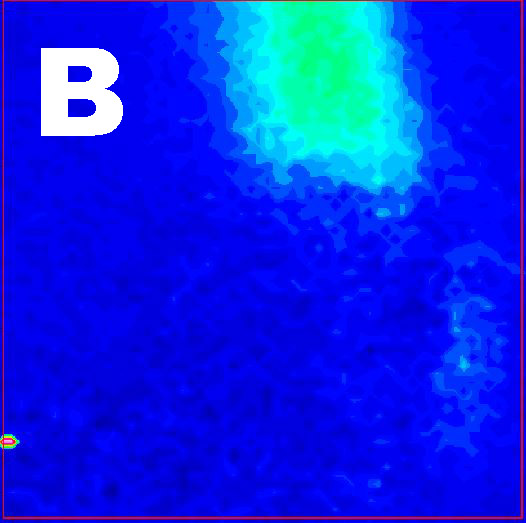
Infrared spectroscopy allows the acquisition of mappings of the distributions of the different compounds detected in the spectra. Using the best microscope objective (x36), we are able to produce a 64x64 pixel large map of an area of about 60 µm large (however, the actual spatial resolution of infrared is diffraction-limited to the studied wavelength, varying between 1-15 micrometers). Mathematical analysis of the data allow us to generate hyperspectral images, that is we have one image of the absorption of infrareds at each wavelength. The two images below correspond to the intensities of the infrared signals in the region pictured above (with the fossil and the paper fiber). A shows the intensity of the absorption of aromatic C=C groups at about 1600 cm-1 (noted A above), and B shows the intensity of the absorption of C-O groups at about 1170 cm-1 (noted B above). We see that aromatic C=C groups are only found in the fossil, whereas C-O groups are mostly detected in the paper fiber contaminant.

We use instruments in Lille at laboratories PhLAM (Bruker Hyperion IR microscope) and LASIR (Bruker Hyperion 3000 IR microscope coupled to Vertex 70 spectrometer).
examples of studies using infrared on microfossils :
Marshall et al. (2005) Combined micro-Fourier transform infrared (FTIR) spectroscopy and micro-Raman spectroscopy of Proterozoic acritarchs: A new approach to Palaeobiology. Precambrian Research
doi.org/10.1016/j.precamres.2005.05.006
Steemans et al. (2010) FTIR characterisation of the chemical composition of Silurian miospores (cryptospores and trilete spores) from Gotland, Sweden. Review of Palaeobotany and Palynology
doi.org/10.1016/j.revpalbo.2010.07.006